Buzzer Basics - Technologies, Tones, and Drive Circuits
There are many choices for communicating information between a product and the user. One of the most common choices for audio communication is a buzzer. Understanding some of the technologies and configurations of buzzers is useful during the design process, so in this blog post we will describe typical configurations, provide example buzzer tones, and present common drive circuit options.
Magnetic and Piezo Buzzers
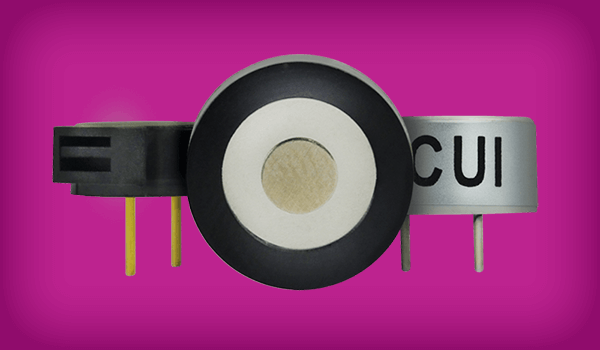
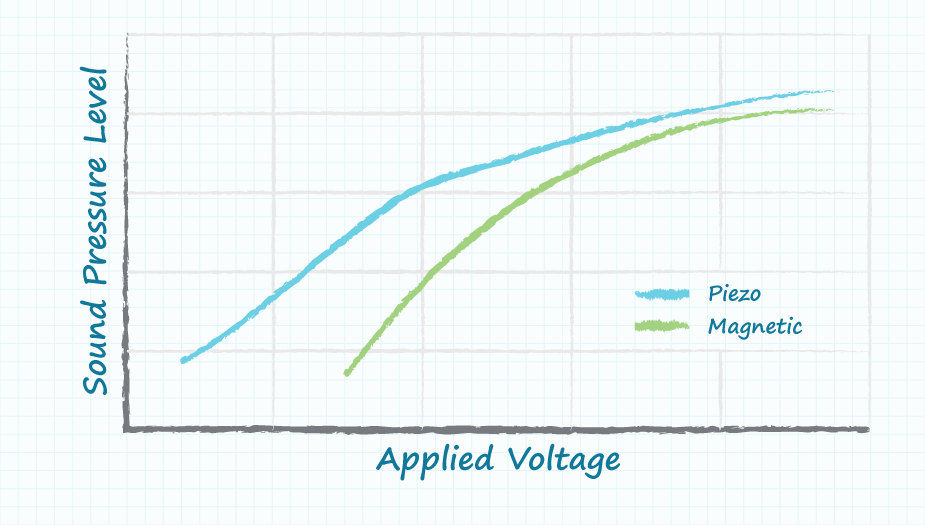
The two most common technologies used in buzzer designs are magnetic and piezo. Many applications use either a magnetic or a piezo buzzer, but the decision regarding which of the two technologies to use is based upon many different constraints. Magnetic buzzers operate at lower voltages and higher currents (1.5~12 V, > 20 mA) compared to piezo buzzers (12~220 V, < 20 mA), while piezo buzzers often have greater maximum sound pressure level (SPL) capability than magnetic buzzers. However, it should be noted that the greater SPL available from piezo buzzers requires larger footprints.
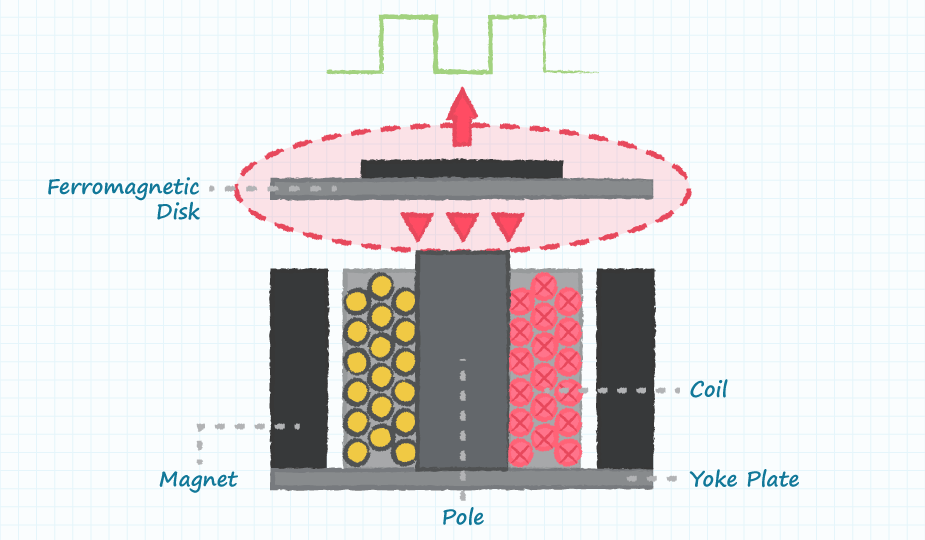
In a magnetic buzzer, a current is driven through a coil of wire which produces a magnetic field. A flexible ferromagnetic disk is attracted to the coil when the current is present and returns to a "rest" position when the current is not flowing through the coil. The sound from a magnetic buzzer is produced by the movement of the ferromagnetic disk in a similar manner to how the cone in a speaker produces sound. A magnetic buzzer is a current driven device, but the power source is typically a voltage. The current through the coil is determined by the applied voltage and the impedance of the coil.
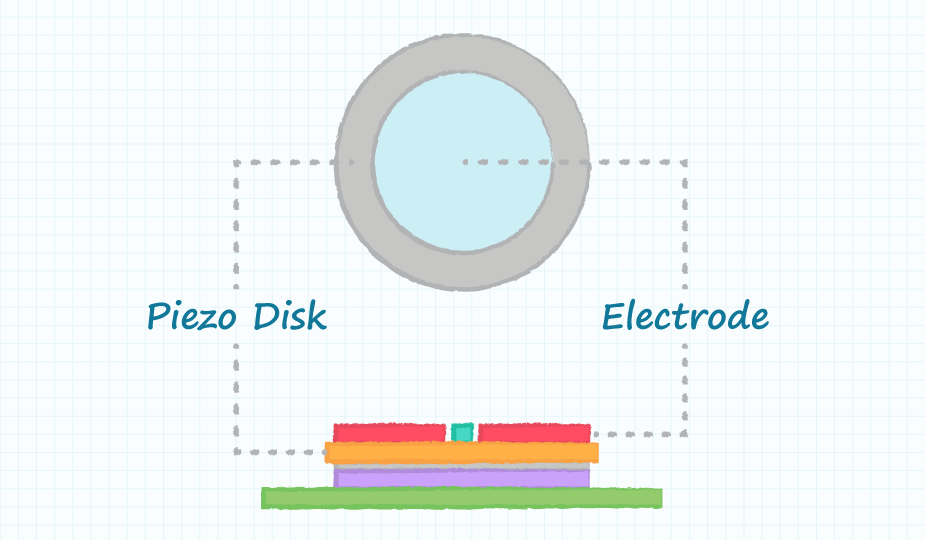
Piezo buzzers are used in similar applications as magnetic buzzers. Piezo buzzers are constructed by placing electrical contacts on the two faces of a disk of piezoelectric material and then supporting the disk at the edges in an enclosure. When a voltage is applied across the two electrodes, the piezoelectric material mechanically deforms due to the applied voltage. This movement of the piezo disk within the buzzer creates sound in a similar manner as the movement of the ferromagnetic disk in a magnetic buzzer or the speaker cone mentioned above.
A piezo buzzer differs from a magnetic buzzer in that it is driven by a voltage rather than a current. A piezo buzzer is modeled as a capacitor while a magnetic buzzer is modeled as a coil in series with a resistor. The frequency of the sound produced by both magnetic and piezo buzzers can be controlled over a wide range by the frequency of the signal driving the buzzer. A piezo buzzer exhibits a reasonably linear relationship between the input drive signal strength and the output audio power while a magnetic buzzer's audio output declines rapidly with a decreasing input drive signal.
Piezo Buzzer Feedback
Some piezo buzzers include a feedback line. Driving circuits for buzzers with feedback tend to be simpler than those circuits without. Feedback is accomplished by dividing the piezo element into two, electrically isolated pieces. When the main piezo element is actuated, it squeezes the feedback portion, creating a voltage on the feedback line. A simple way to use feedback is to have the feedback line connected to the base of a transistor. As the piezo element oscillates, the feedback signal will oscillate, and the transistor will alternately block or allow current to flow.
Transducers and Indicators
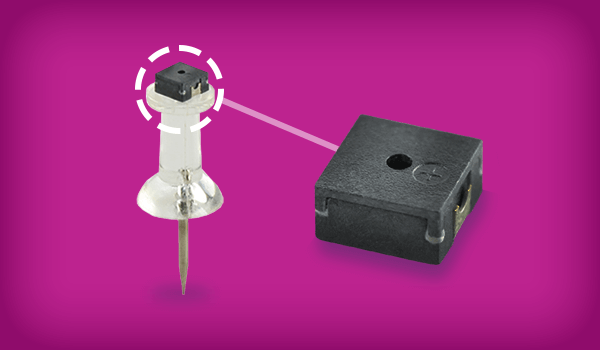
There are two types of magnetic and piezo buzzers: indicators and transducers. Piezo and magnetic indicators have the driving circuitry built into the design, creating a "plug and play" solution. Because of this, engineers do not need to worry about building a complex circuit to drive the buzzer. The disadvantage, however, is that indicators operate on a fixed frequency, reducing the flexibility offered to achieve an alternate frequency as application requirements change. Transducers, on the other hand, do not have the driving circuit built-in, so engineers are offered a greater range of flexibility when designing their circuit. The downside comes in the fact that transducers do require an external driving signal to operate properly, potentially adding complexity and time to the design cycle.
In terms of a general structure, piezo transducers consist of a casing, a piezoceramic element, and a terminal. To operate a transducer, the user must send a square wave signal to the buzzer. Piezo indicators consist of a casing, a piezoceramic element, a circuit board, and a terminal. To operate an indicator, the user must send the buzzer a specified dc voltage.
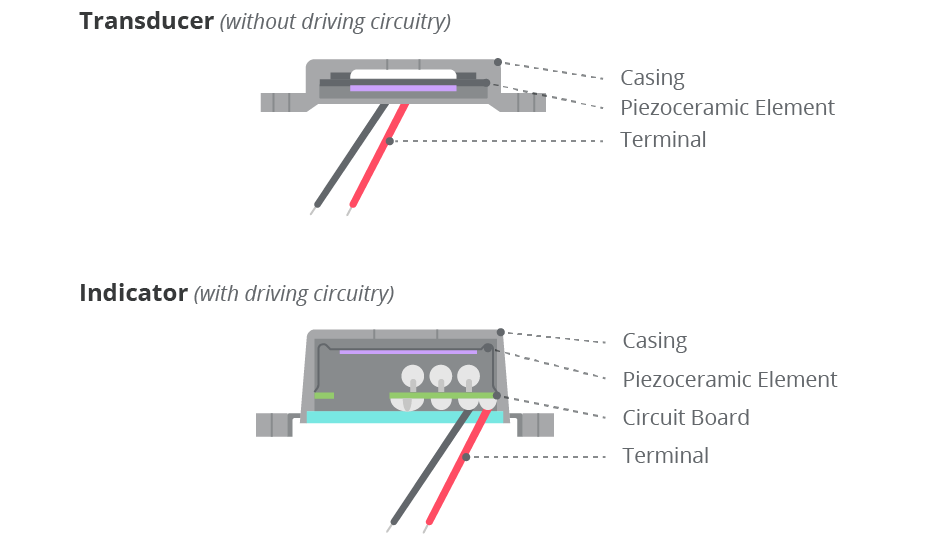
In a magnetic buzzer, the transistor acts as the driving circuit. Magnetic indicators include the transistor, creating a tone when a dc voltage is applied. Magnetic transducers lack this transistor, requiring a square wave signal to operate properly.
Buzzer Tones
The following are some examples of the sounds that buzzers are able to create. The continuous tone and slow/fast pulse sounds can be produced by either an indicator or a transducer.
- Continuous (Feedback/ Warning Signal)
- Indicator Vdc: continuously on
- Transducer excitation waveform: continuous fixed frequency
- Slow/Fast Pulse (Feedback/ Warning Signal)
- Indicator Vdc: switched on and off
- Transducer excitation waveform: pulsed fixed frequency
The high/low tone, siren and chime sounds can be produced only by a transducer and the associated support circuitry due to the multiple frequencies of the signal.
- High/Low Tone (Warning Signal)
- Transducer excitation waveform: rapidly alternating between two frequencies
- Siren (Alarm)
- Transducer excitation waveform: periodic ramping of frequency from low to high
- Chime (Door Bell)
- Transducer excitation waveform: single slow cycle between high and low frequencies
Key Buzzer Specifications
Here are several important buzzer specifications to understand during the selection process:
- Frequency Response – how efficiently a buzzer produces sound at a given frequency.
- Sound Pressure Level (Unit: dB Pa) – sound pressure level, SPL, is the deviation from atmospheric pressure caused by the soundwave expressed in decibel Pascals. It is generally proportional to input voltage and decays by 6 dB's when doubling the distance from the buzzer.
- Resonant Frequency (Unit: F0 Hz) – all things have a specific frequency at which they tend to vibrate. This frequency is called the resonant frequency. For buzzers, the resonant frequency is the frequency at which they will be the loudest.
- Impedance (Unit: ohm) – Electrical impedance is the ratio of applied voltage to current. The electrical impedance varies with frequency.
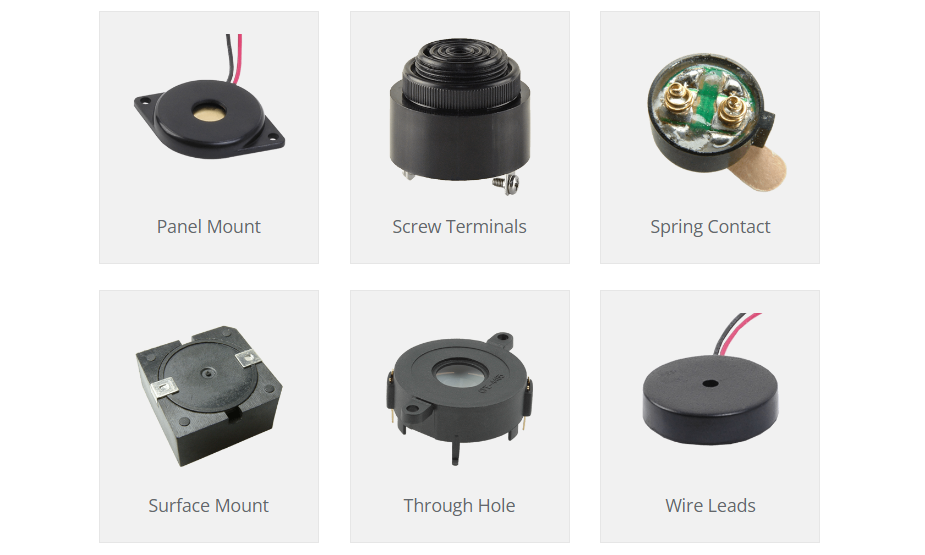
- Mounting Styles – Buzzers are available in various mounting configuration depending on the application need, including panel mount, screw terminals, spring contact, surface mount, through hole, wire leads, and more.
Application Circuit for Magnetic or Piezo Indicator

An indicator requires only a dc voltage to operate and sound is produced whenever the voltage is present.
Application Circuit for Magnetic Transducer
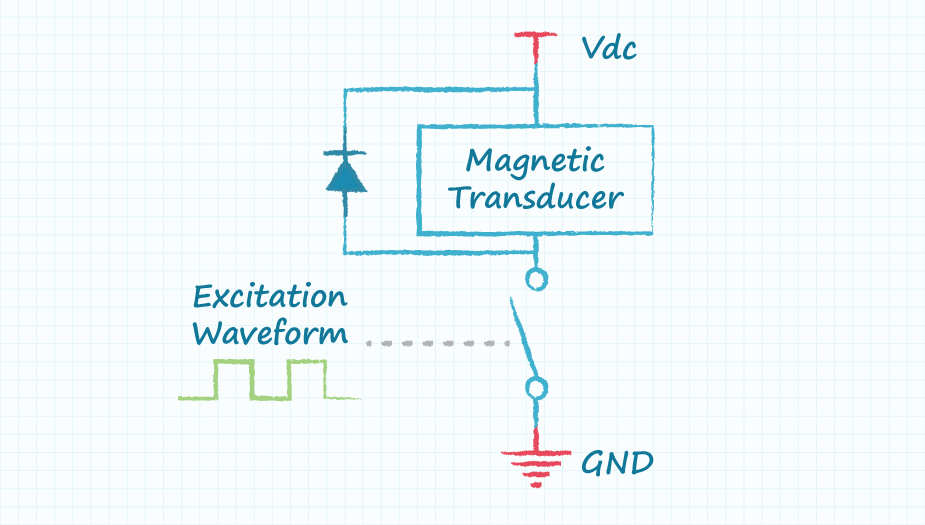
A magnetic transducer requires an excitation waveform to drive the buzzer. Arbitrary wave shapes and a wide range of frequencies can be used for the excitation waveform. The switch in the schematic is used to amplify the excitation waveform and is typically either a BJT or a FET. The diode is required to clamp the fly-back voltage created when the switch (transistor) is shut off quickly.
Application Circuit for Piezo Transducer
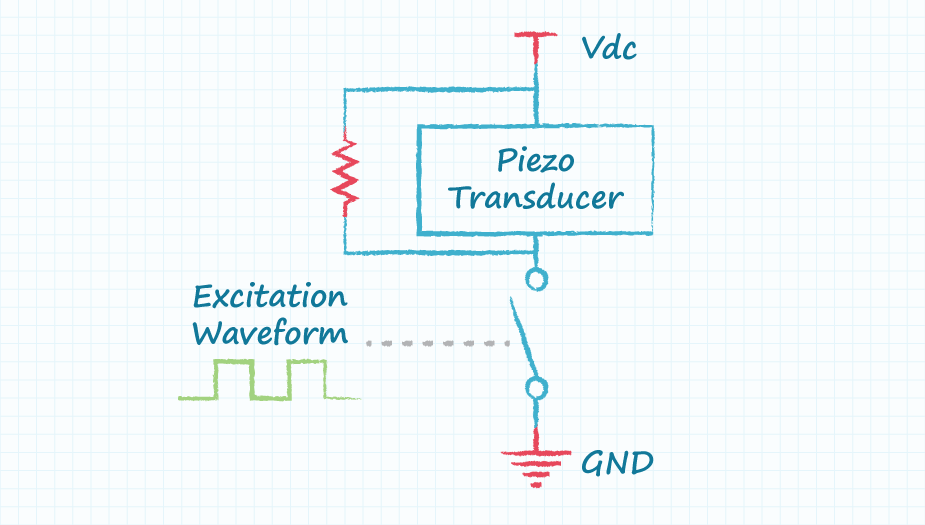
A piezo transducer can be driven with a circuit similar to a magnetic transducer. The diode across the piezo transducer is not required because the inductance of a piezo transducer is small, but a resistor is required to reset the voltage when the switch is open. This circuit is not normally used to drive a piezo transducer because the resistor dissipates power. Other circuits can be used to increase the sound level from a piezo transducer by increasing the peak to peak voltage applied to the transducer.
Full Bridge Circuit for Piezo Transducers
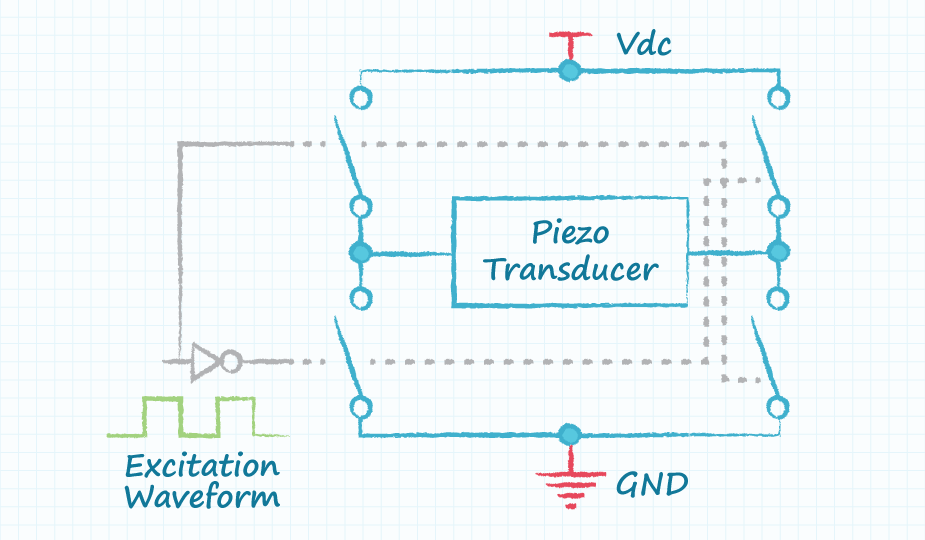
A full bridge circuit is often used for driving piezo transducers. The advantage of using the full bridge comprised of four switches is the peak-to-peak voltage applied across the transducer is twice as large as the available supply voltage. The use of a full bridge driver will cause a resultant increase in the sound volume of about 6 dB due to the doubling of the voltage applied to the transducer.
Conclusion
Buzzers are a simple and inexpensive means of providing communication between electronic products and the user. Piezo and magnetic buzzers are used in similar applications with the primary differences being that magnetic buzzers operate from lower voltages and higher currents than their piezo buzzer counterparts, while piezo buzzers offer users higher SPLs in generally larger footprints. Buzzers configured as indicators require only a dc voltage to operate but are limited to a single audio frequency of operation, whereas transducers require external circuitry, but provide a wider range of audio frequencies.
 Tags:
Tags:
Additional Resources